

The Musée d'Orsay received 3,785,134 visitors in 2025, according to the press release from the public establishment of the Musée d'Orsay and the Musée de l'Orangerie (EPMO) dated January 5, 2026. The record for the series, which began in 2001, was set in 2023 with 3,871,498 visitors. In 2024, the year of the Olympic Games, the total was 3.75 million, which is 3% less. On average, the museum received 12,409 visitors per day open in 2023. This page compiles the official data series, indicating the source of the figures, and notes what is not available: no public data is available on a monthly or hourly basis.
How many visitors does the Musée d'Orsay receive each year since 2001?
The official data comes from two sources. The Ministry of Culture publishes data on all museums in France on data.gouv.fr, covering the period from 2001 to 2016, and then from 2014 to 2024. For 2025, we are using the press release from the EPMO (Association of Directors of French Museums) dated January 5, 2026. We were unable to find any reliable figures for the period 1987-2000, and we are not fabricating any data.
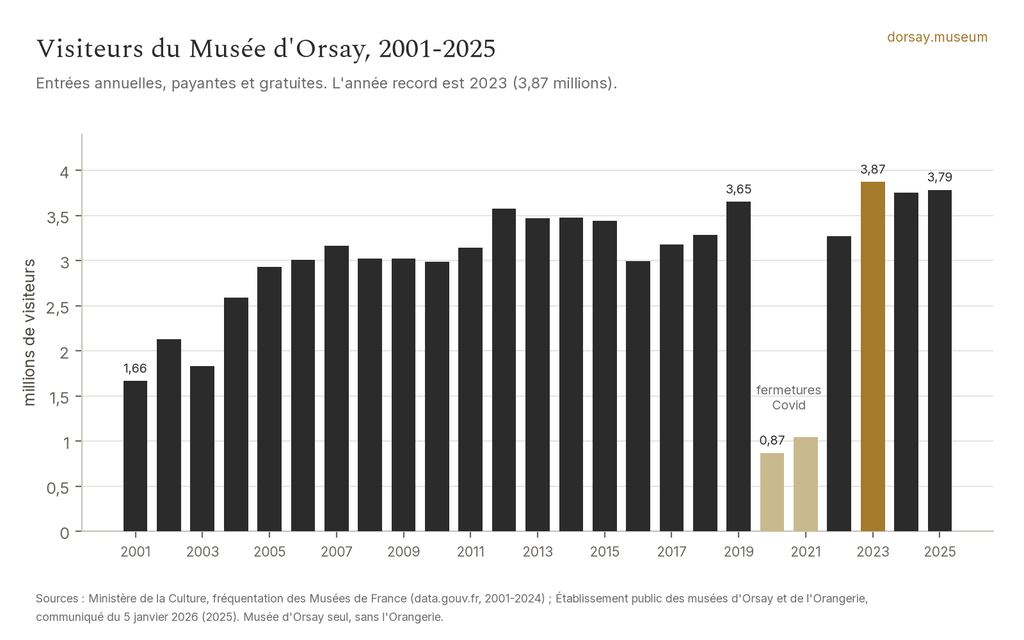
| Year | Visitors | Free options | Note |
|---|---|---|---|
| 2001 | 1,664,678 | 34.6% | Very low value, cause not established |
| 2002 | 2,127,779 | 33.1% | |
| 2003 | 1,829,574 | 34.6% | |
| 2004 | 2,590,316 | 31.0% | |
| 2005 | 2,929,282 | 37.4% | |
| 2006 | 3,009,203 | 39.4% | |
| 2007 | 3,166,509 | 40.6% | |
| 2008 | 3,025,164 | 37.3% | |
| 2009 | 3,022,012 | 43.9% | |
| 2010 | 2,985,510 | 45.1% | |
| 2011 | 3,144,449 | 41.2% | |
| 2012 | 3,579,130 | 38.9% | A 14% increase was observed in 2011, but the cause remains undetermined |
| 2013 | 3,467,321 | 41.8% | |
| 2014 | 3,480,609 | 44.8% | |
| 2015 | 3,439,832 | 46.1% | |
| 2016 | 2,997,625 | 46.9% | A 13% decrease in 2015, with the cause unverified |
| 2017 | 3,177,842 | 46.4% | |
| 2018 | 3,286,224 | 43.7% | |
| 2019 | 3,651,616 | 44.9% | Record before the health crisis: 308 days of operation |
| 2020 | 867,274 | 51.1% | Closure years (due to Covid-19) |
| 2021 | 1,044,365 | 48.6% | Restrictions and closures (COVID-19) |
| 2022 | 3,273,709 | 41.4% | 311 days open |
| 2023 | 3,871,498 | 37.4% | Record for the series: 312 days of operation |
| 2024 | 3,751,681 | 34.4% | Olympic Games: 26% fewer events in the summer of 2023 |
| 2025 | 3,785,134 | 35.2% | Data from the January 2026 press release; figures are rounded |
The series tells three stories. The first is a rise from 2001 to 2007, from 1.66 to 3.17 million, followed by a plateau around 3 million until 2011. The jump in 2012 (3.58 million, +14%) closely follows the reorganization of the Impressionist galleries in 2011, but no source links the two; we do not either. The second is the collapse of 2020: 867,274 visitors, which is 76% less than in 2019. The third is the return to a level above pre-crisis levels: 2023 exceeds 2019 by 6%, and 2025 by 3.7%.
A detail about 2024: the 2024 press release stated 3,751,141, while the Ministry's dataset and the 2025 press release state 3,751,681. We will use the second value, which is more recent and confirmed by two sources, and we will write "3.75 million."
How many people enter each day?
The activity report of the institution provides the average daily attendance on days open: 11,856 in 2019 (308 days), 10,526 in 2022 (311 days), and 12,409 in 2023 (312 days). The calculation verifies: 3,871,498 divided by 312 gives 12,409.
This average is a benchmark, not a forecast. It combines slow days and peak days, mornings starting at 9:30 AM, and Thursday evening openings. A free Sunday or a day during school holidays likely exceeds the average; we don't know by how much, because the museum doesn't publish daily figures.

What 12,409 people per day represent
If the museum had been open every day from 9:30 AM to 6:00 PM, these 12,409 visitors would have represented just over 1,400 people entering each hour. This calculation is theoretical: visitor numbers are concentrated during certain hours, and the last entry is at 5:00 PM on regular days.
To prepare for the day, first, choose the month, day, and time; to determine the duration, see how much time to allocate.
What happened in 2020 and 2021?
The two years of the health crisis resulted in 867,274 visitors in 2020 and 1,044,365 in 2021, with an unusually high percentage of free visits, 51% and then 49%. The museum closed and reopened several times; we were unable to find a source that provides the exact number of days it was closed, and we do not estimate it. In 2022, attendance returned to 3,273,709, which is 10% below 2019, with 311 days of opening.
Did the 2024 Olympic Games lead to a decline in museum visitors?
During the summer of 2024, the museum lost 26% of its visitors compared to the summer of 2023 (22% for the Orangery), according to the EPMO press release from January 2025. For the entire year, the decline was only 3%: 3,751,681 visitors compared to 3,871,498. Another effect noted by the museum is that the 26-45 age group represented 34% of the visitors during the period, compared to 11% in 2023.
The 26% decrease is the only figure that measures a museum's performance over a season. It is also an exceptional case (the Games), so it is not a standard.
Should we conclude that summers are generally quieter? No: that particular summer was the summer of the Olympics, with heightened security measures and special traffic arrangements in Paris. There is no other comparable public event that takes place during the summer at the Musée d'Orsay.
One in three visitors enters for free
The proportion of free entries varies from 31% (2004) to 47% (2016), excluding years of closure, and it rises to 51% in 2020. It is 37% in 2023, 34% in 2024, and 35% in 2025 (the 2025 press release states "1,332,000", rounded). According to its 2024 press release, the museum has been free since 2012 for those under 26 years old from the European Union. The categories of free entries are detailed on the page about free entries. Ticket prices are in the ticket section, not here.
Where do the visitors come from?
| Year | Foreign visitors | Most represented countries | Source |
|---|---|---|---|
| 2019 | 56% | United States: 13%, Italy: 6%, United Kingdom: 4% | 2019 Activity Report |
| 2023 | 59% | United States: 13%, Italy: 8%, United Kingdom: 4%, Germany: 3% | 2023 Activity Report |
| 2024 | 56% | United States: 11.5%, Italy: 6.9%, United Kingdom: 4.2%, Germany: 3.6%, South Korea: 2.7% | EPMO 2024 Announcement |
| 2025 | 64% | United States: 14%, Italy: 8%, United Kingdom: 4%, Germany: 4%, Japan: 2% | EPMO 2025 Announcement |
The jump from 2024 to 2025 (56% then 64% of foreigners, which is from 44% to 36% of French people) should be treated with caution: the press release does not explain it, and a change in survey methodology is possible. Therefore, we are not talking about an increase in the foreign audience. In 2019, the activity report divided the French audience into 15% from Paris, 14% from the Île-de-France region, and 15% from other regions; those under 26 years old represent 32% of visitors in 2025.
"Nearly 5 million visitors": What are we talking about?
The EPMO manages two museums: Orsay and the Orangerie. The total of 4,914,345 visitors in 2025 includes 3,785,134 visitors to Orsay and 1,129,211 to the Orangerie (which was closed from January 28th to March 2nd, 2025). In 2024, 3,751,681 plus 1,198,694 equals 4.95 million; in 2023, 3,871,498 plus 1,239,539 equals 5,111,037. When an article states "nearly 5 million" for Orsay, it includes both museums. The older figures (3 million, 3.2 million) correspond to other periods in the series.
What days and times does the museum consider to be its busiest?
The only official schedule of days is a page on the museum's website, archived in May 2021: "peak days and times." It is provided for informational purposes only and has no contractual value, it no longer appears on the current website (we were unable to find it there), and it dates from before the 2026 renovations. We reproduce it as is:
| Day | 9:30 AM - 1:00 PM | 1:00 PM - 6:00 PM | 6:00 PM - 9:45 PM (evening hours) |
|---|---|---|---|
| Tuesday | Important | Important | No overnight stay |
| Wednesday | Average | Average | No overnight stay |
| Thursday | Supported | Supported | Average |
| Friday | Average | Average | No overnight stay |
| Saturday | Supported | Supported | No overnight stay |
| Sunday | Important | Important | No overnight stay |
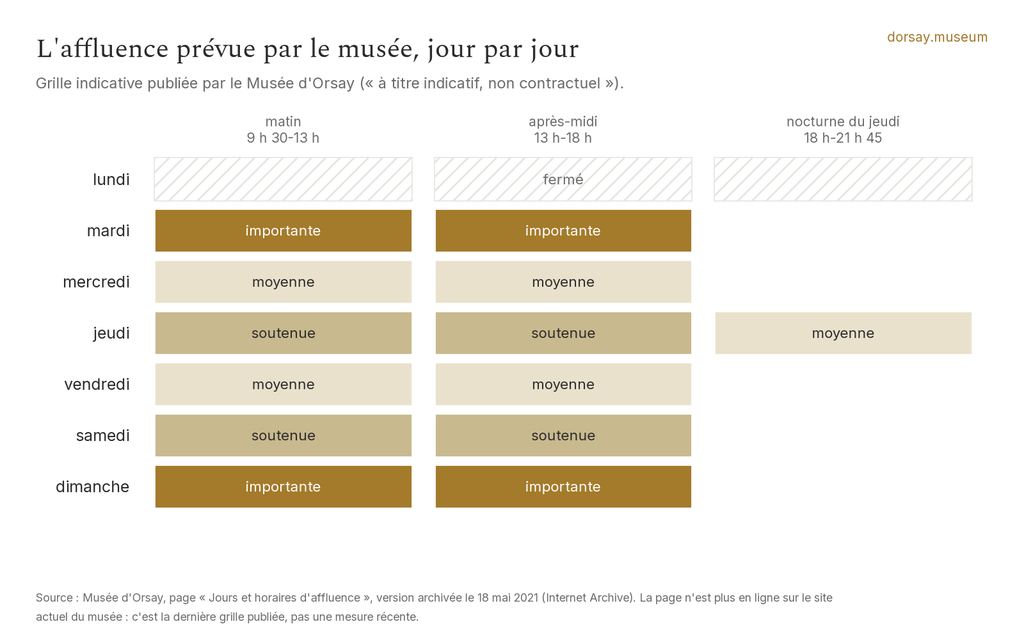
Two clarifications. First, the grid does not indicate any quiet hours: the lowest level is "average." Secondly, Tuesday being marked as "high" might be related to the Louvre being closed on that day, but the museum does not state this. On Mondays, the museum is closed. For information on hours and evening openings, please see the page about Thursday evening openings.
A monthly indicator that is not based on museum attendance
Due to the lack of a monthly series from Orsay, "seasonal" curves are circulating. The only solid monthly series we found is that of the Insee: the number of hotel nights in the Île-de-France region, from 2012 to 2026. We calculated the ratio between the number of nights in each month and the monthly average for the year (index 100), and then averaged the data for the eight years from 2012 to 2019, excluding the crisis years.
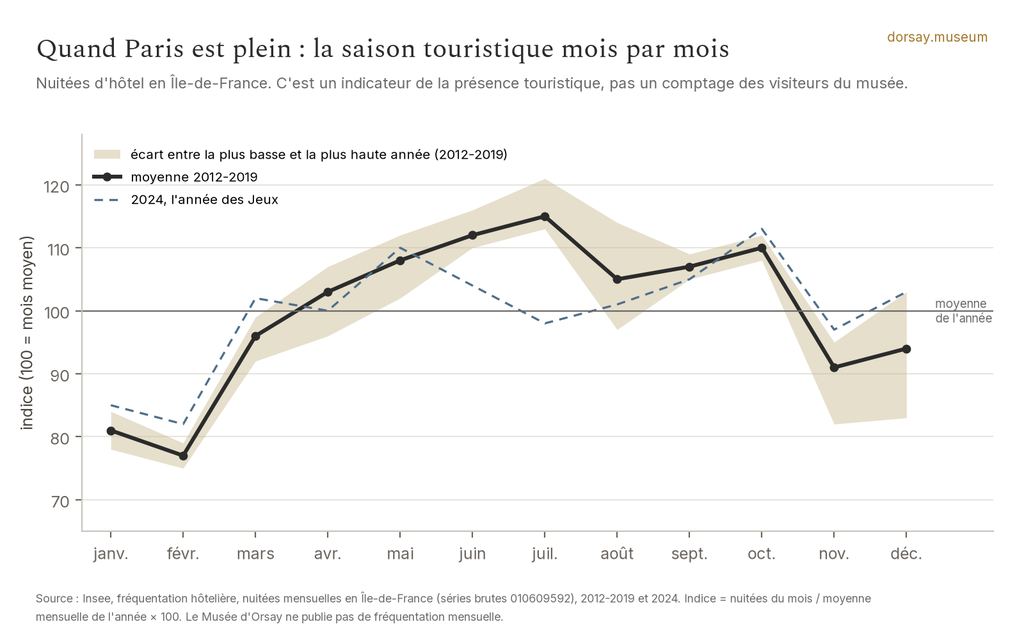
| Month | Average 2012-2019 | Yearly difference | 2023 | 2024 |
|---|---|---|---|---|
| January | 81 | 78-84 | 86 | 85 |
| February | 77 | 75-79 | 80 | 82 |
| March | 96 | 92 to 99 | 95 | 102 |
| April | 103 | 96 to 107 | 107 | 100 |
| May | 108 | 102 to 112 | 109 | 110 |
| June | 112 | 110-116 | 116 | 104 |
| July | 115 | 113 to 121 | 113 | 98 |
| August | 105 | 97 to 114 | 102 | 101 |
| September | 107 | 105 to 109 | 103 | 105 |
| October | 110 | 108 to 112 | 104 | 113 |
| November | 91 | 82-95 | 90 | 97 |
| December | 94 | 83 to 103 | 94 | 103 |
Why doesn's this index measure attendance at the Orsay museum? Because it counts hotel nights, not entries; because it covers the entire Île-de-France region; because 36 to 44% of the museum's visitors are French and often stay at their own homes; and because a successful exhibition alone can shift hundreds of thousands of visitors (Caillebotte: 587,858 visitors in 2024-2025). The months with a low index, January and February, are months with less tourist activity in Paris, nothing more. We are not considering 2025: the reference index is the average for 2012-2019, the last period without health crises or the Olympic Games.
What doesn't exist, and why you should be wary of those who mention it
We searched for monthly or hourly data in the 2019, 2022, and 2023 activity reports, in the 2024 and 2025 press releases, and in the ministry's dataset (annual only). The museum does not publish either monthly or hourly breakdowns of visits. The "hour-by-hour" graphs that you see on some websites and services are estimates from third parties: the museum does not publish the methodology, and we cannot verify them. An article that states, for example, "on Tuesdays at 11 am, 70% of visitors," without citing a source, does not report any actual measurements.
How we compiled these figures
Each figure on this page comes from a dated public source, consulted on November 6, 2026. The 2001-2016 data comes from the Ministry of Culture (dataset "Museum Attendance in France"), the 2014-2024 data from the same ministry, and the 2025 data from an EPMO press release dated January 5, 2026. The daily averages are based on the 2019, 2022, and 2023 activity reports; we have verified the calculations. The percentage changes (+6%, -76%, -3%) are our own calculations based on the totals. The "35%" figure for free admissions in 2025 is an approximation from the press release.
Dorsay.museum is an independent website, not affiliated with the Musée d'Orsay or the public establishment of the Musée d'Orsay and the Musée de l'Orangerie. We display, through partnerships, tickets and tours offered by third parties, and these figures have no connection to what we sell. The page on how we verify our information is linked at the bottom.
When two sources contradict each other, we prioritize the most recent information, provided it is corroborated by a second source. We make this clear when it applies (as is the case for 2024).
Frequently Asked Questions about Attendance
How many visitors did the Musée d'Orsay receive in 2025?
3,785,134 entries, according to the EPMO statement of January 5, 2026, which is approximately 1% more than in 2024.
What is the museum d'Orsay's record for visitor attendance?
2023, with 3,871,498 visitors. The year 2019 (3,651,616) was the record before the health crisis, but not the absolute record of the series.
How many people enter each day?
On average, 12,409 visitors per opening day in 2023, according to the activity report. Peak days have higher numbers, but the museum does not publish figures per day.
Does the museum receive nearly 5 million visitors?
No, that figure refers to the combined total for the Orsay and Orangerie museums: 4,914,345 in 2025. The Orsay museum alone receives approximately 3.8 million.
What percentage of the visitors are foreign?
According to the EPMO's press release, the figure is 64% in 2025, 56% in 2024, and 59% in 2023. The press release does not explain the increase in 2025.
How many entries are free?
Approximately 35% in 2025 (37% in 2023, 34% in 2024). The categories of free services are described on the dedicated page.
What is the busiest day?
In 2021, the museum categorized Tuesdays and Sundays as "high traffic" days in its schedule. However, it does not publish daily visitor numbers.
Are there any statistics available on visitor numbers per hour?
The museum does not provide this information. The curves you see on other websites are estimates provided by third parties.
Did the Olympic Games lead to a decrease in attendance?
Yes, in the summer: 26% lower than the summer of 2023. Over the entire year, the decrease is only 3%.
Data verified on . Data: Ministry of Culture, EPMO, INSEE (French National Institute of Statistics and Economic Studies), collected on November 6, 2026. This is an independent website, not affiliated with the Musée d'Orsay. Politique éditoriale